Table of Contents
1. Introduction to Sample of Null Hypothesis
In the realm of statistical analysis and hypothesis testing, the concept of a null hypothesis holds significant importance. Let’s delve into what exactly a null hypothesis entails, its structure, significance levels, types, applications, and much more. In any statistical study, researchers aim to test hypotheses to draw meaningful conclusions about populations or phenomena.
The null hypothesis, often denoted as Ho serves as the default assumption or the status quo that there is no significant difference or effect. It represents the hypothesis of no change or no effect. A sample of Null Hypothesis could be: “There is no significant difference in the mean scores of two groups.”
2. Understanding Sample of Null Hypothesis Testing
What is a Null Hypothesis?
The null hypothesis proposes that there is no difference or relationship between variables or that any observed difference is due to random variation. It essentially assumes that any observed difference is the result of chance.
Importance of Null Hypothesis in Research
The null hypothesis is crucial in hypothesis testing as it provides a benchmark for comparison. It allows researchers to evaluate the strength of evidence against the null hypothesis and determine whether the observed results are statistically significant.
3. Structure of a Null Hypothesis
Formulation
A null hypothesis is typically formulated as a statement that there is no effect, no relationship, or no difference between variables. It is often expressed in terms of population parameters.
Examples
Ho: µ= 50 (The population mean is equal to 50)
Ho: σ2= 25 (The population variance is equal to 25)

4. Significance Levels and Rejection Criteria
Alpha Levels
Significance levels play a crucial role in hypothesis testing, a fundamental aspect of statistical analysis. When conducting research or analyzing data, researchers need to determine the significance of their findings to draw valid conclusions. This article explores the significance levels and rejection criteria, focusing on alpha levels and their implications in statistical inference.

1. Understanding Alpha Levels
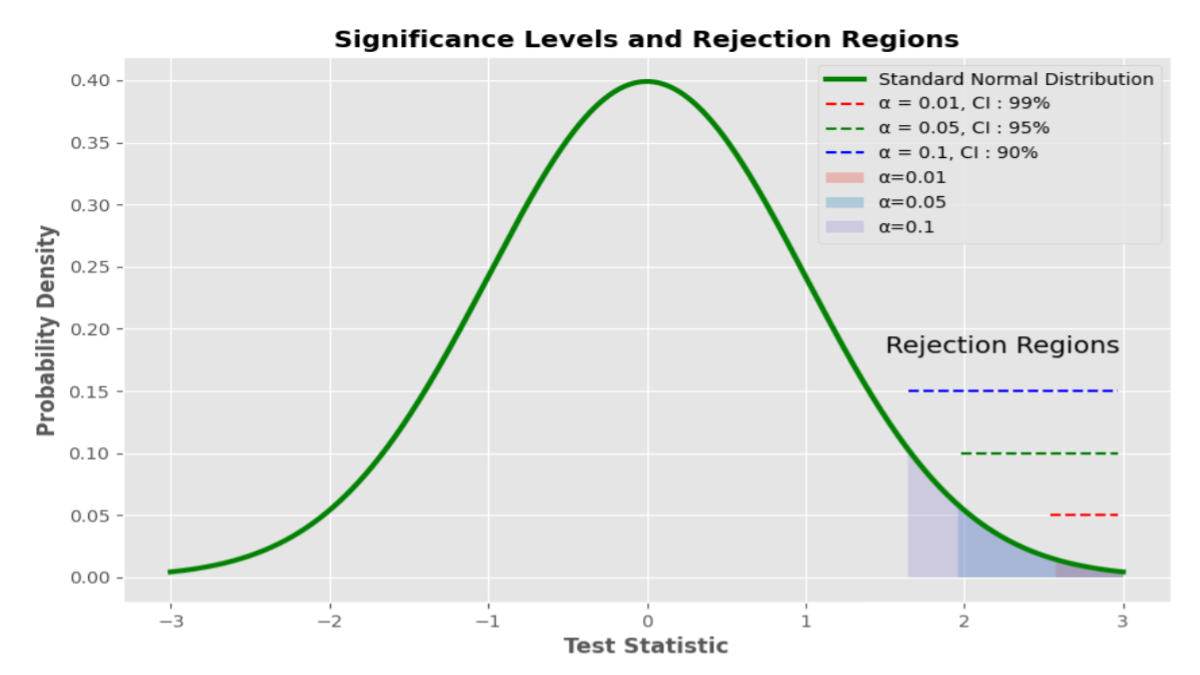
Alpha levels, often denoted as α, represent the threshold for accepting or rejecting a null hypothesis. In simpler terms, it indicates the likelihood of rejecting the null hypothesis when it is actually true. Commonly used alpha levels include 0.05, 0.01, and 0.10, although researchers may choose other values based on the context of their study. It’s essential to note that alpha levels are directly related to significance levels, as they determine the critical region for hypothesis testing.
2. Rejection Criteria in Hypothesis Testing
Rejection criteria define the conditions under which researchers reject the null hypothesis in favor of the alternative hypothesis. These criteria depend on factors such as the chosen alpha level, sample size, and statistical power. There are different types of rejection criteria, including the critical value approach, p-value approach, and confidence interval approach, each with its advantages and limitations.
3. Importance of Choosing the Right Alpha Level
Choosing the appropriate alpha level is crucial as it directly influences the likelihood of Type I and Type II errors. A Type I error occurs when the null hypothesis is wrongly rejected, while a Type II error occurs when the null hypothesis is wrongly accepted. Researchers must balance the risks associated with these errors to ensure the validity of their findings.
4. Common Alpha Levels in Different Fields
Alpha levels vary across different fields and disciplines. For example, in medical research, a more conservative alpha level (e.g., 0.01) may be preferred to minimize the risk of false positives. In contrast, social sciences may use a higher alpha level (e.g., 0.10) due to the exploratory nature of many studies. Factors such as sample size, effect size, and practical implications also influence the choice of alpha levels.
Critical Values
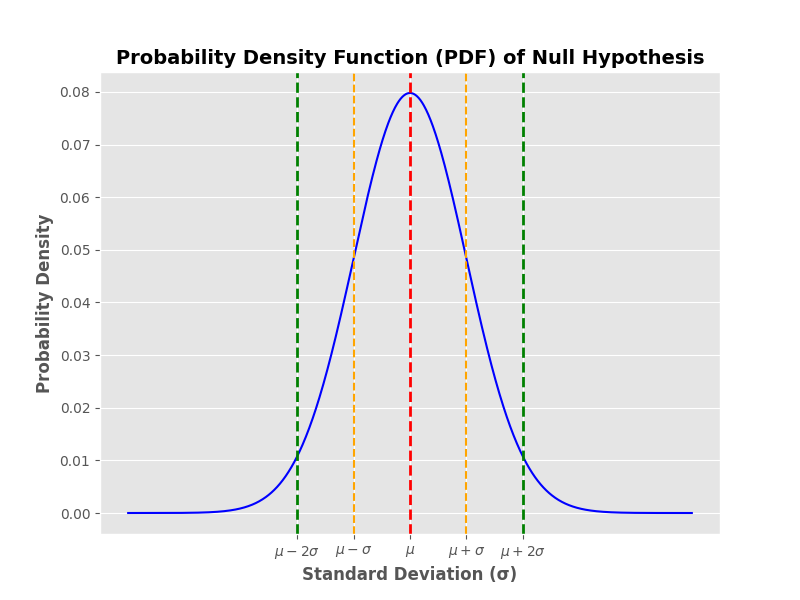
Critical values are thresholds used to determine whether to reject the null hypothesis based on the observed test statistic. These critical values are determined based on the chosen significance level and the distribution of the test statistic.

1. Determining Critical Values
Critical values are determined based on the chosen significance level, often denoted by the Greek letter alpha (α). The importance of the significance level lies in its indication of the likelihood of rejecting the null hypothesis, even when it is valid. Common methods for determining critical values include reference tables, statistical software, and mathematical formulas tailored to specific statistical tests and distributions.
2. Critical Values in Hypothesis Testing
In hypothesis testing, critical values play a vital role in assessing the statistical significance of results. Researchers compare the calculated test statistic with the critical value associated with the chosen significance level. If the test statistic exceeds the critical value, it suggests that the observed results are unlikely to have occurred by chance, leading to the rejection of the null hypothesis in favor of the alternative hypothesis.
3. Z-Score and Critical Values
The z-score, also known as the standard score, represents the number of standard deviations a data point is from the mean of a distribution. Critical values for z-tests are commonly used in scenarios involving large sample sizes or when the population standard deviation is known. These critical values help determine the boundaries for rejecting or retaining the null hypothesis based on the calculated z-score.
4. T-Value and Critical Values
When dealing with smaller sample sizes or situations where the population standard deviation is unknown, t-tests are employed, and critical values for t-tests are utilized. These critical values are derived from the t-distribution and are crucial for determining the significance of results obtained from t-tests.
5. Chi-Square Test and Critical Values
The chi-square test is frequently used in categorical data analysis to assess the association between categorical variables or goodness-of-fit to a particular distribution. Critical values for chi-square tests are employed to determine whether the observed data significantly deviate from the expected values under the null hypothesis.
6. Critical Values in Confidence Intervals
Critical values are integral to constructing confidence intervals, which provide estimates of population parameters based on sample data. The margin of error in confidence intervals is determined by the critical value corresponding to the chosen confidence level, allowing researchers to quantify the uncertainty associated with their estimates.
7. Evaluating Significance with Critical Values
Proper evaluation of significance using critical values requires careful consideration of various factors, including the chosen significance level, sample size, and assumptions underlying the statistical test. Researchers must critically assess the relevance and implications of their findings based on the observed test statistics and corresponding critical values.
8. Critical Values in Regression Analysis
In regression analysis, critical values play a crucial role in assessing the significance of regression coefficients, testing hypotheses about relationships between variables, and evaluating the overall fit of regression models. By comparing calculated test statistics with critical values derived from appropriate distributions, researchers can make informed inferences about the strength and direction of relationships in their data.
5. Common Misconceptions about the Null Hypothesis
Many mistakenly interpret a non-significant result as evidence in support of the null hypothesis rather than acknowledging the possibility of Type II errors. It’s essential to recognize that failing to reject the null hypothesis does not necessarily mean accepting it as true.
6. Applications of Null Hypothesis in Different Fields
Null hypothesis testing is widely utilized in various disciplines, including psychology, biology, economics, and sociology, to evaluate research hypotheses and draw conclusions. It provides a systematic approach to analyzing data and making inferences about populations.
7. Challenges and Limitations of Null Hypothesis Testing
Sample Size Determination
Determining an appropriate sample size is crucial for hypothesis testing to ensure adequate statistical power. Small sample sizes may lead to unreliable results and increased risk of Type II errors.
Selection Bias
Selection bias occurs when the sample is not representative of the population, leading to skewed or biased results. Researchers must take steps to minimize selection bias and ensure the generalizability of findings.
Assumptions Violation
In academic writing, researchers must clearly articulate their null hypotheses, along with alternative hypotheses, to facilitate the reproducibility and transparency of their findings. This involves clearly stating the research question, formulating testable hypotheses, and providing a rationale for the chosen hypotheses. A Sample of Null Hypothesis might be that there is no significant difference in the mean scores between the control group and the experimental group.
8. Future Directions in Null Hypothesis Research
Advancements in statistical methodologies and computational techniques continue to shape the landscape of null hypothesis testing. Researchers are exploring innovative approaches to address existing limitations and improve the robustness of hypothesis tests.
9. Null Hypothesis in Academic Writing
In academic writing, researchers must clearly articulate their null hypotheses, along with alternative hypotheses, to facilitate the reproducibility and transparency of their findings. This involves clearly stating the research question, formulating testable hypotheses, and providing a rationale for the chosen hypotheses. An example of a Sample of Null Hypothesis could be testing whether there is no difference in test scores between students who receive traditional instruction versus those who receive online instruction.
10. Practical Tips for Formulating Null Hypotheses
Specificity
Null hypotheses should be specific and clearly define the expected outcome or lack thereof. Vague or ambiguous null hypotheses can lead to confusion and misinterpretation of results.
Testability
Null hypotheses should be testable using empirical data and statistical methods. Researchers should ensure that null hypotheses can be falsified through hypothesis testing procedures.
Theoretical Grounding
Null hypotheses should be grounded in relevant theoretical frameworks and previous research findings. This helps to contextualize the research question and provides a basis for formulating testable hypotheses.
11. Null Hypothesis Examples in Real Studies
Psychology
In psychological research, null hypotheses are commonly used to assess the absence of relationships or differences between variables. For example, a study may test whether there is a difference in anxiety levels between two treatment groups.
Biology
In biology, null hypotheses are often used to evaluate the effectiveness of treatments or interventions. For instance, a study may test whether a new drug has no effect on the growth rate of cancer cells compared to a placebo. This Sample of Null Hypothesis allows researchers to rigorously assess the impact of the treatment by comparing it to a scenario where there is assumed to be no effect.
Economics
In economics, null hypotheses are frequently employed to assess the impact of policy interventions or changes in economic variables. For example, a study may test whether there is no difference in unemployment rates before and after the implementation of a new government policy.
12. Considerations in Null Hypothesis Testing
Statistical Power
Statistical power denotes the likelihood of accurately rejecting the null hypothesis when it’s invalid. Higher statistical power increases the likelihood of detecting true effects or differences.
Effect Size
Effect size quantifies the extent of the disparity or correlation between variables. A larger effect size indicates a stronger relationship or more significant difference.
Confidence Intervals
Confidence intervals offer a span of values where the true population parameter is expected to lie. They offer additional insights into the precision and reliability of estimated effects.
Multiple Comparisons
When conducting multiple hypothesis tests simultaneously, researchers must adjust for multiple comparisons to control the overall Type I error rate. Common methods include Bonferroni correction and false discovery rate control.
13. Practical Implications of Null Hypothesis Testing
Decision Making
Null hypothesis testing informs decision-making processes in various domains, including medicine, business, and public policy. Statistical evidence obtained from hypothesis tests guides strategic planning and resource allocation. A Sample of Null Hypothesis in this context could be that there is no significant difference in sales performance between two different marketing strategies.
Policy Development
Governments and organizations rely on null hypothesis testing to evaluate the effectiveness of policies and interventions. Evidence-based policymaking requires rigorous evaluation of hypotheses and empirical data.
Scientific Inquiry
Null hypothesis testing is fundamental to scientific inquiry and the advancement of knowledge. It enables researchers to systematically investigate research questions and generate new insights into natural phenomena.
14. Emerging Trends in Null Hypothesis Testing
Bayesian Approaches
Bayesian methods offer an alternative framework for hypothesis testing that incorporates prior knowledge and uncertainty into statistical inference. Bayesian hypothesis testing allows for more flexible modeling and robust estimation of parameters.
Machine Learning Techniques
Machine learning techniques, such as deep learning and neural networks, are increasingly being applied to hypothesis-testing problems. These approaches enable automated feature extraction and pattern recognition, facilitating complex data analysis and interpretation. A Sample of Null Hypothesis could involve testing whether a specific neural network architecture yields no improvement in accuracy compared to a baseline model.
Reproducibility Initiatives
Efforts to promote reproducibility and transparency in research have led to the development of reproducibility initiatives and open science practices. These initiatives aim to address issues of publication bias, data sharing, and methodological transparency in null hypothesis testing.
15. Example for Sample of Null Hypothesis in “R” Code
1. Assumption, Plots, and t-test for a sample of the null hypothesis in “R” code
library(psych)
library(tidyverse)

sample1 <- c(10, 11, 12, 15, 16, 13, 14, 12, 13, 15, 14, 13, 14, 15)

summary(sample1)
# 1. Assumption (Continuous scale) - check(skew kurtosis - values)
describe(sample1)

# 2. Assumption (Normality)

shapiro.test(sample1)
# Plot
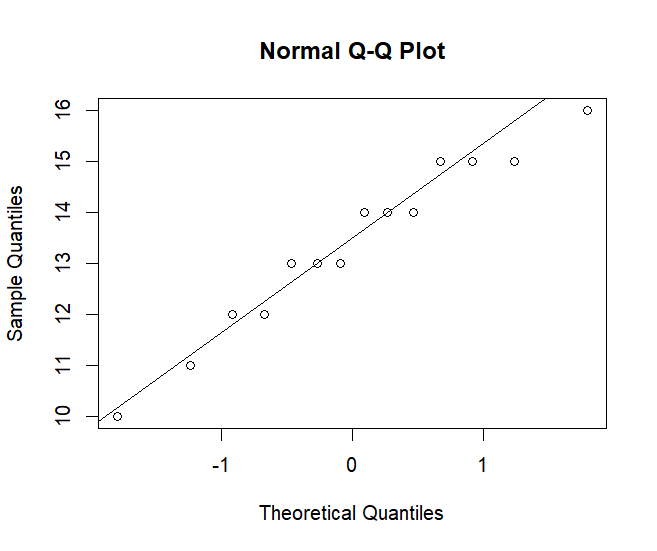
qqnorm(sample1)
qqline(sample1)


# 3. Assumption (Outlier)
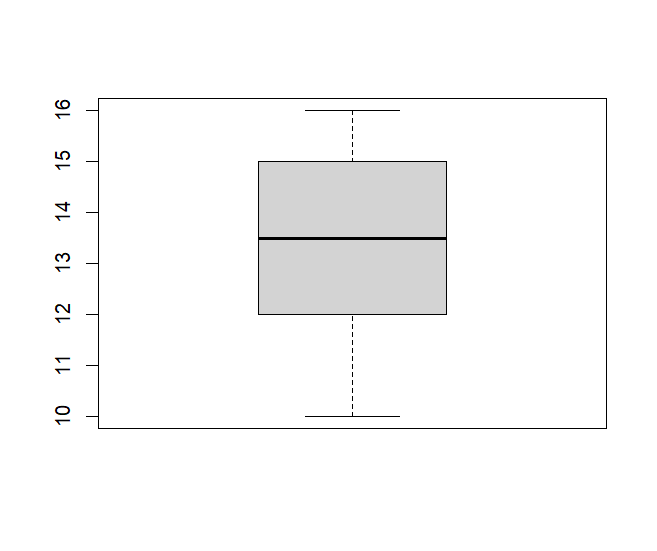
boxplot(sample1)

#One sample  t-test

t.test(sample1, mu=13, alpha=.05, alternative = "two.sided")

2. The plot of the sample of null Hypothesis in “R” Code
# Load required libraries
library(ggplot2)

# Sample data
sample_data <- c(10, 11, 12, 15, 16, 13, 14, 12, 13, 15, 14, 13, 14, 15)

# Sample mean and confidence interval
sample_mean <- 13.35714
ci_lower <- 12.38025
ci_upper <- 14.33404

# Create a data frame for plotting
df <- data.frame(x = sample_data)

# Plot histogram with ggplot2
ggplot(df, aes(x)) +
  geom_histogram(aes(y=..density..), bins = 10, fill = 'gray', color = 'black', alpha = 0.7) +
  geom_density(color = 'black',size = 1.0) +
  geom_vline(xintercept = sample_mean, linetype = 'dashed', color = 'red', size = 1) +
  geom_vline(xintercept = c(ci_lower, ci_upper), linetype = 'dashed', color = 'blue', size = 0.9) +
  labs(title = 'Sample Data with 95% CI', x = 'Values', y = 'Density') +
  theme_grey() +
  theme(legend.position = 'top') +
  guides(color = FALSE)

16. Example for Sample of Null Hypothesis in “Python” Code
1. Analysis of null hypothesis
##             Example for Sample of Null Hypothesis

import numpy as np
import matplotlib.pyplot as plt
import seaborn as sns
from scipy import stats

# Example data
sample = np.array([10, 11, 12, 15, 16, 13, 14, 12, 13, 15, 14, 13, 14, 15])

# Hypothesized population mean
pop_mean = 13.0

# Perform one-sample t-test
t_statistic, p_value = stats.ttest_1samp(sample, pop_mean)

# Calculate the mean and standard deviation
sample_mean = np.mean(sample)
sample_std = np.std(sample, ddof=1)  # Using Bessel's correction (ddof=1) for sample standard deviation

# Calculate the standard error of the mean (SEM)
n = len(sample)
sem = sample_std / np.sqrt(n)

# Calculate the 95% confidence interval (CI)
t_critical = stats.t.ppf(0.975, df=n-1)  # Two-tailed test
ci_lower = sample_mean - t_critical * sem
ci_upper = sample_mean + t_critical * sem

# Print the results of the t-test
print("T-statistic:", t_statistic)
print("P-value:", p_value)

# Interpret the results of the t-test
alpha = 0.05  # significance level
if p_value < alpha:
    print("Reject the null hypothesis. The sample mean is significantly different from the population mean.")
else:
    print("Fail to reject the null hypothesis. The sample mean is not significantly different from the population mean.")

2. Example plot for Sample of Null Hypothesis in “Python” Code
import numpy as np
import matplotlib.pyplot as plt
import seaborn as sns
from scipy import stats

plt.style.use('ggplot')
plt.figure(figsize=(8, 6))

# Example data
sample = np.array([10, 11, 12, 15, 16, 13, 14, 12, 13, 15, 14, 13, 14, 15])

# Hypothesized population mean
pop_mean = 13.0

# Perform one-sample t-test
t_statistic, p_value = stats.ttest_1samp(sample, pop_mean)

# Calculate the mean and standard deviation
sample_mean = np.mean(sample)
sample_std = np.std(sample, ddof=1)  # Using Bessel's correction (ddof=1) for sample standard deviation

# Calculate the standard error of the mean (SEM)
n = len(sample)
sem = sample_std / np.sqrt(n)

# Calculate the 95% confidence interval (CI)
t_critical = stats.t.ppf(0.975, df=n-1)  # Two-tailed test
ci_lower = sample_mean - t_critical * sem
ci_upper = sample_mean + t_critical * sem

# Plot histogram with KDE, setting the line color to gray and the line width to 1
sns.histplot(sample, kde=True, color='gray', stat='density', linewidth=1)
plt.title('Sample Data with 95% CI')
plt.xlabel('Values')
plt.ylabel('Density')

# Plot the sample mean with a line color of red, dashed linestyle, and line width of 3
plt.axvline(x=sample_mean, color='red', linestyle='--', linewidth=3, label='Sample Mean')

# Plot the 95% confidence interval with a line color of green, dashed linestyle, and line width of 2
plt.axvline(x=ci_lower, color='green', linestyle='--', linewidth=2, label='Lower 95% CI')
plt.axvline(x=ci_upper, color='green', linestyle='--', linewidth=2, label='Upper 95% CI')

#plt.savefig(' save _ sample of null hypothesis plot .png')

# Show the plot
plt.show()

17. Conclusion
In conclusion, the null hypothesis serves as a foundational concept in hypothesis testing, enabling researchers to assess the validity of alternative hypotheses and draw evidence-based conclusions from empirical data. Understanding the role and significance of null hypotheses is essential for conducting rigorous and meaningful research across various disciplines.
A sample of a null hypothesis might involve stating that there is no significant difference in test scores between two groups. In conclusion, null hypothesis testing is a fundamental tool in statistical analysis and scientific inquiry, providing a systematic approach to evaluating research hypotheses and drawing evidence-based conclusions. By grasping the fundamentals and practicalities of null hypothesis testing, scholars can bolster the precision and trustworthiness of their investigations, thus fostering progress in their specific domains of expertise.
Critical values are indispensable tools in statistical analysis, providing researchers with essential guidelines for interpreting data and drawing meaningful conclusions. By understanding the significance of critical values and their implications in different statistical procedures, practitioners can enhance the rigor and reliability of their research findings, contributing to advancements in their respective fields.
18. FAQs
Q1: What is the purpose of the null hypothesis? The null hypothesis provides a baseline assumption for hypothesis testing, allowing researchers to evaluate whether observed differences or effects are statistically significant.
Q2: How do you interpret a p-value in null hypothesis testing? A p-value represents the probability of observing a test statistic as extreme as, or more extreme than, the one observed, given that the null hypothesis is true. A decreased p-value signifies more compelling evidence opposing the null hypothesis.
Q3: Can you have a null hypothesis without an alternative hypothesis? Yes, it is possible to formulate a null hypothesis without explicitly specifying an alternative hypothesis. However, in hypothesis testing, researchers typically consider both null and alternative hypotheses to assess the presence of an effect or relationship.
Q4: What are Type I and Type II errors in null hypothesis testing? Type I error occurs when the null hypothesis is incorrectly rejected, falsely indicating the presence of an effect or difference. Type II error occurs when the null hypothesis is incorrectly retained, failing to detect a true effect or difference.
Q5: How can researchers mitigate the risk of Type I errors in hypothesis testing? Researchers can reduce the risk of Type I errors by adjusting the significance level alpha or conducting post-hoc analyses to confirm the robustness of significant findings.
Q6: What is statistical power, and why is it important in null hypothesis testing? Statistical power is the likelihood of accurately dismissing the null hypothesis when it’s untrue. It is important in null hypothesis testing because it determines the ability of a study to detect true effects or differences. Higher statistical power increases the likelihood of finding significant results if they exist.
Q7: How do you calculate effect size in null hypothesis testing? Effect size gauges the extent of the disparity or association between variables. It is typically calculated using standardized metrics such as Cohen’s d for means or Pearson’s r for correlations. Effect size calculations provide additional insights into the practical significance of research findings beyond statistical significance.
Q8: What are confidence intervals, and how are they used in null hypothesis testing? Confidence intervals offer a range of values where the true population parameter is expected to lie, with a specified level of confidence. They are used in null hypothesis testing to estimate the precision and reliability of estimated effects or differences. Confidence intervals offer a more nuanced understanding of research findings and help interpret the practical significance of results.
Q9: How do researchers address ethical considerations in null hypothesis testing? Researchers address ethical considerations in null hypothesis testing by adhering to ethical guidelines and standards of conduct. This includes obtaining informed consent from participants, minimizing risks, protecting confidentiality, and ensuring research integrity. Transparent reporting of methods and results promotes reproducibility and accountability in null hypothesis testing.
Q10: What are some emerging trends in null hypothesis testing? Emerging trends in null hypothesis testing include Bayesian approaches, machine learning techniques, and reproducibility initiatives. Bayesian methods incorporate prior knowledge and uncertainty into statistical inference, while machine learning techniques enable automated data analysis and interpretation. Reproducibility initiatives aim to promote transparency and openness in research practices, addressing issues of publication bias and methodological transparency.
Read more
